35 Data Analyst Python Interview Questions and Answers to Know
Screening a data analyst candidate on Python skills is harder than it sounds. Ask the wrong questions and you end up hiring someone who can recite syntax but can't clean a messy dataset or debug a broken pandas pipeline. If you're building out a list of data analyst python interview questions, you need ones that actually separate strong analysts from candidates who just memorized flashcards.
This article gives you exactly that: a working set of 35 interview questions covering everything from basic data types to pandas, NumPy, and data cleaning scenarios that mirror real analyst work. Each question comes with a clear answer, so whether you're a hiring manager prepping for a screening call or a candidate rehearsing answers with an AI interviewer, you'll know what a solid answer sounds like and what a red flag looks like.
We've organized the questions by difficulty, starting with fundamentals suited to python interview questions for freshers data analyst roles, then moving into intermediate Python interview questions and advanced territory involving data manipulation and statistical analysis. If you're recruiting for data analyst roles at scale, pair this list with a scoring rubric that keeps every interview consistent so every interviewer evaluates candidates against the same bar instead of gut feel.
1. Python fundamentals every data analyst should know
Before you dig into pandas or statistics, confirm the candidate has a solid grip on Python basics. This is where you weed out people who've only ever copy-pasted code from tutorials. A fresher preparing for python interview questions for data analyst roles should be able to answer every question in this section without hesitation, and the same holds for any Python basics question bank aimed at beginners, since these fundamentals show up in almost every technical screen.
What is Python and why do analysts use it?
Python is a general-purpose, interpreted programming language known for readable syntax and a massive ecosystem of data libraries, which is why it shows up across so many kinds of Python applications. Analysts favor it over spreadsheet tools because it handles large datasets, automates repetitive cleaning tasks, and connects directly to databases, APIs, and visualization libraries like Matplotlib and Seaborn. A strong candidate will mention pandas and NumPy by name and explain that Python lets them script an entire analysis pipeline, from raw data to final chart, instead of clicking through a GUI.
A data analyst who can't explain why Python beats a spreadsheet for repeatable analysis probably hasn't used it for real work.
What are Python's built-in data types?
Candidates should rattle these off without checking notes. Listen for whether they understand when to use each one, not just the names.
| Data Type | Example | Mutable? | Common Use in Analysis | |---|---|---| | int | 42 | No | Counting rows, indexing | | float | 3.14 | No | Calculations, averages | | str | "revenue" | No | Column names, labels | | list | [1, 2, 3] | Yes | Storing sequences of values | | tuple | (1, 2) | No | Fixed coordinate pairs, function returns | | dict | {"a": 1} | Yes | Key-value lookups, JSON data | | set | {1, 2, 3} | Yes | Removing duplicates, membership checks | | bool | True/False | No | Filtering conditions |
Good follow-up: ask why a tuple is useful when a list already exists. The right answer touches on immutability protecting data from accidental changes.
How do you write a function in Python?
Hiring managers ask this to confirm basic syntax fluency, then follow up by asking the candidate to modify the function on the spot. Here's a simple example worth having candidates walk through line by line:
def calculate_growth_rate(current_value, previous_value):
    """Return percentage growth between two values."""
    if previous_value == 0:
        return None
    return ((current_value - previous_value) / previous_value) * 100

result = calculate_growth_rate(120, 100)
print(result)  # 20.0
Watch for whether the candidate handles the division-by-zero edge case unprompted. That instinct separates analysts who've hit real production bugs from those who haven't.
What is list comprehension and how does it work?
List comprehension lets you build a new list from an existing iterable in a single readable line, instead of writing a multi-line for loop. It's a favorite interview topic because it reveals whether someone writes Pythonic, efficient code or defaults to verbose habits from other languages.
# Traditional loop
squared = []
for n in [1, 2, 3, 4]:
    squared.append(n ** 2)

# List comprehension
squared = [n ** 2 for n in [1, 2, 3, 4]]
A strong follow-up question: ask the candidate to add a conditional filter, like squaring only even numbers. If they write [n ** 2 for n in nums if n % 2 == 0] without pausing, you've confirmed real fluency, not memorized syntax.
2. Pandas questions for data manipulation
Once you confirm the basics, move into pandas, the library every data analyst touches daily, and the exact skill you're checking when you hire vetted Python Pandas developers. These python data analysis interview questions reveal whether a candidate can actually wrangle real datasets, not just recite documentation from memory.

How do you read a CSV file into a DataFrame?
Ask this early because it's the most common first step in any analysis. The expected answer is pd.read_csv("filename.csv"), but a stronger candidate mentions parameters like sep, header, dtype, and parse_dates that handle messy real-world files. Encoding errors trip up junior analysts constantly, so listen for whether they mention encoding="utf-8" or troubleshooting a UnicodeDecodeError on a client file.
What is the difference between loc and iloc?
Confusing these two is one of the fastest ways to spot a candidate who's only worked with toy datasets. loc selects rows and columns by label, while iloc selects by integer position. A candidate should explain that df.loc[0:5] includes the row labeled 5, while df.iloc[0:5] stops before index 5, exactly like standard Python slicing.
If a candidate can't explain loc versus iloc cleanly, they haven't spent real hours inside pandas.
How do you handle missing values in Pandas?
Missing data shows up in nearly every dataset, so this question matters more than it looks. Candidates should know df.isnull().sum() for detection, then discuss trade-offs between dropna() and fillna() depending on how much data is missing and whether that missingness looks random. Watch for whether they mention imputation strategies like filling with the mean, median, or a forward fill for time series data.
How does groupby work for data aggregation?
Groupby splits a DataFrame into groups based on a column, applies a function to each group, then combines the results back together. A solid answer references the split-apply-combine pattern by name and can write something like df.groupby("region")["sales"].sum() without hesitating over syntax.
How do you merge or join two DataFrames?
Finally, test whether the candidate understands relational data, a skill that matters for anyone tackling python data analyst interview questions involving multiple source tables, and one worth probing further with database questions built for analyst roles. pd.merge() combines DataFrames on shared keys, and candidates should explain the difference between inner, outer, left, and right joins, ideally with a quick example of when a left join preserves unmatched rows from the primary table.
3. NumPy questions for numerical computing
NumPy sits underneath pandas, so a candidate who understands it usually writes faster, cleaner analysis code. These questions test whether someone actually grasps array-based computation or just imports NumPy because a tutorial told them to. This section fits well within a broader set of python data analyst interview questions since numerical operations show up constantly once you move past basic spreadsheets.
What is NumPy and why is it used in data analysis?
NumPy provides the n-dimensional array object that pandas, scikit-learn, and most Python data tools build on top of. Analysts use it because operations on NumPy arrays run in compiled C code, making them dramatically faster than looping through native Python lists for large numerical datasets. A candidate worth hiring will mention vectorized operations as the core reason NumPy replaces manual loops, and might reference the official NumPy documentation as a source they've actually read, not just skimmed.
How do you create and index a NumPy array?
Expect fluency with basic array creation and slicing syntax. A candidate should move through this without hesitation:
import numpy as np

arr = np.array([10, 20, 30, 40, 50])
print(arr[1:4])       # [20 30 40]
print(arr[arr > 20])  # [30 40 50]

matrix = np.array([[1, 2], [3, 4]])
print(matrix[0, 1])   # 2
Boolean indexing, shown in the second line above, comes up constantly in real filtering tasks, so push candidates to explain what arr[arr > 20] actually does under the hood.
What is broadcasting in NumPy?
Broadcasting lets NumPy perform operations on arrays of different shapes without writing explicit loops, as long as the shapes are compatible according to NumPy's rules. For example, adding a single number to an entire array, or adding a 1D array to each row of a 2D array, works automatically because NumPy stretches the smaller array to match the larger one's shape.
A candidate who can explain broadcasting in one sentence understands NumPy at a deeper level than someone who's only memorized array syntax.
Good interview candidates connect broadcasting back to performance: without it, analysts would need manual loops for every element-wise operation, which defeats the entire purpose of using NumPy instead of native Python lists.
4. Data cleaning and preprocessing questions
Raw data rarely arrives ready for analysis, so this section tests whether a candidate can actually clean a messy dataset instead of just running models on tidy sample data. These questions come up constantly in python data analyst interview questions because cleaning eats most of an analyst's actual working hours, far more than modeling ever does.
How do you detect and remove duplicate records?
Spotting duplicates starts with df.duplicated().sum() to count them, then df.drop_duplicates() to remove them. A sharper candidate asks a clarifying question before writing code: should duplicates be flagged across all columns, or just a subset like email or customer ID? That instinct matters because dropping the wrong duplicates silently deletes legitimate records, and a candidate who jumps straight to code without asking hasn't cleaned real production data.
How do you detect and treat outliers?
Detecting outliers usually starts with visual checks like a boxplot, then statistical methods like the interquartile range (IQR) or z-scores for a more programmatic cutoff. A strong answer explains the tradeoff clearly: dropping outliers entirely can erase legitimate edge cases like a genuine high-value transaction, while capping values (winsorizing) preserves the record but limits its influence on downstream statistics.
An analyst who treats every outlier as an error to delete hasn't thought hard enough about what the data is actually measuring.
How do you convert data types in a DataFrame?
Conversion questions test whether a candidate has hit the classic "numbers stored as strings" problem. The expected tools are astype() for straightforward conversions and pd.to_numeric() or pd.to_datetime() when the column contains messy or mixed-format values. Listen for whether they mention the errors="coerce" parameter, which turns unparseable values into NaN instead of crashing the whole script.
What is one-hot encoding and when do you use it?
One-hot encoding converts a categorical column into multiple binary columns, one per category, so machine learning models can process text labels as numbers. pd.get_dummies() handles this in one line, but candidates should flag the dummy variable trap, where keeping every generated column introduces multicollinearity, usually solved by dropping one column with drop_first=True.
5. Data visualization questions
A data analyst who can't turn a DataFrame into a clear chart loses half their value, no matter how clean their pandas code is, which is why teams often hire vetted data visualization developers alongside analysts. These python data analyst interview questions test whether candidates can communicate findings visually, not just compute them. Charting questions also reveal whether someone thinks about the audience for a chart, or just calls whatever function comes to mind first.

How do you create charts with Matplotlib?
Matplotlib remains the foundation most other Python visualization libraries build on, so candidates should know the basic syntax cold. Expect something like:
import matplotlib.pyplot as plt

plt.plot(df["month"], df["revenue"])
plt.title("Monthly Revenue")
plt.xlabel("Month")
plt.ylabel("Revenue ($)")
plt.show()
Strong candidates mention customizing figure size, adding labels, and saving output with plt.savefig() for reports. Weak candidates only know plt.plot() and nothing else, which signals they've never actually shipped a chart to a stakeholder.
What is Seaborn and how does it differ from Matplotlib?
Seaborn sits on top of Matplotlib and adds statistical plotting shortcuts with better default styling. Where Matplotlib requires manual work to build a heatmap or a distribution plot, Seaborn does it in one line, for example sns.heatmap(df.corr(), annot=True) for a correlation matrix. A candidate worth hiring explains that they reach for Seaborn when they want fast, polished statistical charts, and Matplotlib when they need fine-grained control over a custom layout.
An analyst who only knows one visualization library will eventually build the wrong chart for the wrong audience.
Which chart types fit which analysis tasks?
This question separates analysts with real judgment from those who just memorized syntax. Push candidates to match the chart to the question being asked, not just to their favorite plot.
| Analysis Goal | Recommended Chart |
|---|---|
| Comparing categories | Bar chart |
| Showing trend over time | Line chart |
| Showing distribution | Histogram or boxplot |
| Showing relationship between two variables | Scatter plot |
| Showing correlation across many variables | Heatmap |
| Showing part-to-whole breakdown | Stacked bar (avoid pie charts for more than 3-4 categories) |
A candidate who flags pie charts as overused for anything beyond a few categories usually has real reporting experience, not just tutorial knowledge.
6. Statistics questions asked in Python interviews
Statistics separates analysts who can explain why a number matters from those who just report it. These python data analysis interview questions test whether a candidate reaches for the right statistical tool instead of running every dataset through the same generic summary.
How do you calculate descriptive statistics in Python?
Descriptive stats start with df.describe(), which returns mean, median, standard deviation, and quartiles in one call. Candidates should also know individual functions like df["column"].mean(), .median(), and .std(), and explain when median beats mean, specifically when a column contains skewed data or extreme outliers that would distort an average.
How do you measure correlation between variables?
Correlation gets tested constantly because it's easy to compute and easy to misinterpret. df.corr() returns a matrix using Pearson correlation by default, but a strong candidate flags that correlation doesn't imply causation and mentions Spearman correlation as the right choice for non-linear or ranked relationships.
Correlation without a causation caveat is a red flag, not a finding.
What is a normal distribution and why does it matter?
A normal distribution is symmetric around its mean, following the familiar bell curve shape, and it matters because many statistical tests assume the underlying data follows it. Candidates should mention that they check this assumption with a histogram, a QQ plot, or a formal test like Shapiro-Wilk before trusting results from a parametric test. Reference material from sources like the NIST statistical handbook covers this in depth, and candidates who cite solid statistical grounding stand out.
How do you run a hypothesis test in Python?
Hypothesis testing questions confirm a candidate can move beyond descriptive stats into actual inference. Expect them to use scipy.stats for common tests:
from scipy import stats

group_a = [23, 25, 28, 22, 27]
group_b = [30, 32, 29, 31, 33]

t_stat, p_value = stats.ttest_ind(group_a, group_b)
print(p_value)
Listen for whether they explain the p-value threshold correctly, typically 0.05, and whether they mention checking assumptions like equal variance before choosing a t-test over a non-parametric alternative like the Mann-Whitney U test.
7. Working with dates and time series data
Time series work trips up analysts who've only ever handled static, one-time-snapshot datasets. These questions test whether a candidate can wrangle timestamps correctly instead of treating dates as plain strings, a mistake that quietly breaks sorting, filtering, and trend analysis.
How do you handle datetime data in Pandas?
Converting a column to proper datetime format starts with pd.to_datetime(df["date_column"]), which turns messy string dates into objects pandas can actually sort, filter, and subtract. Strong candidates mention setting the datetime column as the index with df.set_index("date_column"), since that unlocks slicing by year, month, or even a specific date range without writing manual filters. Extracting components like df["date"].dt.year or .dt.day_name() also comes up often, especially when an interviewer asks how you'd break sales data down by weekday to catch a pattern.
A candidate who stores dates as plain strings hasn't done real time series analysis, no matter what their resume says.
Watch for whether they mention handling timezone-aware data with tz_localize() and tz_convert(), since global companies often pull data from servers logging in UTC while stakeholders expect local time.
What is resampling and when do you use it?
Resampling changes the frequency of time series data, either compressing it (downsampling) or expanding it (upsampling). A daily sales dataset resampled to monthly totals uses:
monthly_sales = df.resample("M").sum()
Candidates should explain the difference between resampling and a simple groupby: resampling understands time-based frequency rules like weekly, monthly, or quarterly, while groupby only works on existing column values. A sharp answer also covers common aggregation choices, since summing works for sales totals but averaging fits metrics like daily active users. This question shows up constantly in python data analyst interview questions because so much real analyst work involves comparing performance across weeks or quarters, not just single days. Ask a follow-up about forward-filling missing periods after upsampling, since that's where junior candidates usually stumble.
8. Advanced Pandas and performance questions
Senior analysts get tested on more than syntax; interviewers want proof they can write efficient, maintainable pandas code that won't crawl to a halt on a million-row dataset. These questions round out any list of python data analyst interview questions, and pair well with senior-level Python questions on performance and internals, because they separate candidates who've only worked with small CSV files from those who've actually fought with production-scale data.
What is method chaining and why use it?
Method chaining links multiple pandas operations together in one readable statement instead of creating a new intermediate variable at every step. A candidate should write something like:
result = (
    df[df["revenue"] > 0]
    .groupby("region")
    .agg({"revenue": "sum"})
    .sort_values("revenue", ascending=False)
)
Good candidates explain that chaining keeps code readable and debuggable, since each transformation reads top to bottom like a sentence, and they'll mention wrapping long chains in parentheses instead of backslashes for cleaner formatting.
How do you optimize memory usage for large DataFrames?
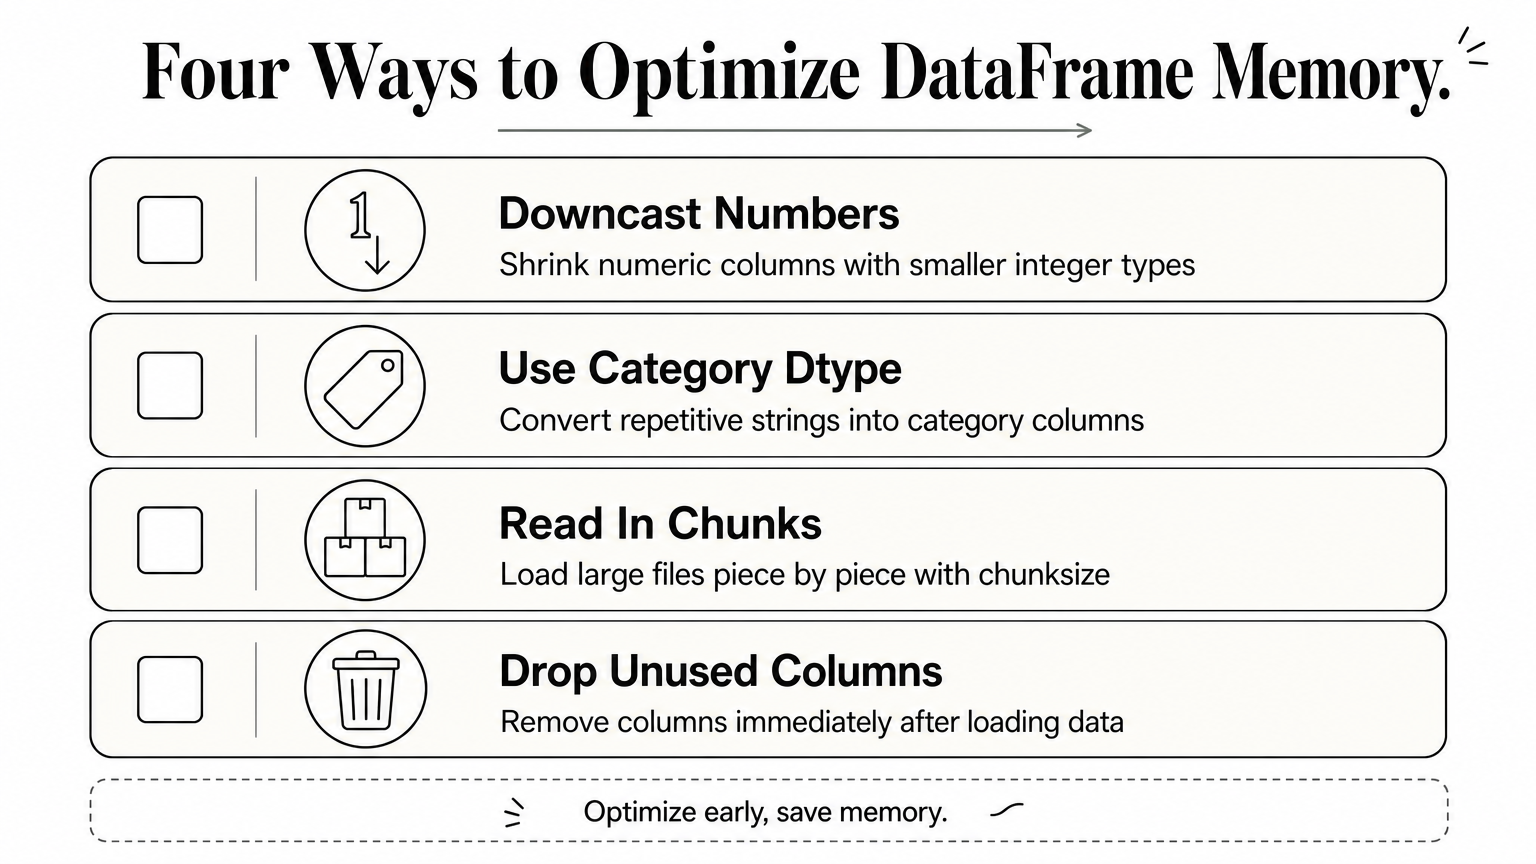
Memory questions expose whether a candidate has ever hit a MemoryError on a real job. Expect them to mention:
- Downcasting numeric columns with
pd.to_numeric(col, downcast="integer") - Converting repetitive string columns to the
categorydtype - Reading large files in chunks with
chunksizeinpd.read_csv() - Dropping unused columns immediately after loading instead of keeping the full dataset in memory
An analyst who's never had to think about memory usage hasn't worked with a dataset large enough to matter.
Candidates who reference df.info(memory_usage="deep") to check actual memory footprint before optimizing usually have real production experience, not textbook knowledge.
How do you reshape data with pivot, stack, and melt?
Reshaping questions test whether a candidate can move fluidly between wide and long data formats, a skill that comes up constantly when preparing data for reporting tools or visualization libraries. pivot() turns unique row values into columns, melt() does the reverse by collapsing columns into rows, and stack()/unstack() shift data between a flat index and a hierarchical one. Strong answers include a quick example, like using df.melt(id_vars="date", var_name="metric", value_name="value") to convert a wide sales report into long format for a Seaborn chart, proving they've actually reshaped data for a real deliverable rather than just reading the documentation once.
9. Python coding and problem-solving questions
Beyond libraries, interviewers want proof a candidate can write plain Python without leaning on pandas for every task. These questions test core programming logic, the kind that shows up in take-home assignments and whiteboard rounds alike, much like a broader set of Python coding challenges with worked answers. Weak candidates freeze here even after acing the pandas section, which tells you their pandas knowledge might be memorized rather than earned.
How do you handle errors with try and except?
Error handling questions check whether a candidate writes code that survives messy real-world input instead of crashing on the first bad row. A solid answer wraps risky operations in a try block and catches specific exceptions rather than a bare except:
try:
    value = int(row["revenue"])
except ValueError:
    value = None
except KeyError:
    value = None
Listen for whether they mention finally for cleanup steps like closing a file connection, and whether they avoid swallowing errors silently without logging what went wrong.
How do you write a function that removes duplicates?
This question tests raw logic without a library shortcut. A candidate should produce something like:
def remove_duplicates(items):
    seen = set()
    result = []
    for item in items:
        if item not in seen:
            seen.add(item)
            result.append(item)
    return result
A candidate who reaches for a set to solve deduplication understands time complexity, not just syntax.
Push them to explain why a set beats checking item in result on every iteration; the answer should touch on O(1) lookup time versus scanning a growing list.
How would you count word frequency in a text?
This classic exercise checks comfort with dictionaries and string methods. Expect a candidate to lowercase the text, split on whitespace, and tally counts, ideally mentioning collections.Counter as a faster shortcut once they've shown they can build it manually first.
How do you reverse a string or list without built-ins?
Banning reversed() or slicing forces candidates to demonstrate actual algorithmic thinking rather than recalling a one-liner. A common answer swaps elements from both ends toward the middle using a loop and two pointers, which reveals whether someone understands index manipulation at a fundamental level, a skill that transfers directly to debugging tricky pandas indexing errors later on.
10. Machine learning basics for data analyst interviews
Most data analyst roles don't require building models from scratch, but interviewers still expect candidates to understand the preprocessing steps that feed into machine learning, since analysts often prepare data that data scientists later model. These questions confirm a candidate can bridge analysis and modeling without needing a full ML background.
How do you scale or normalize features before modeling?
Scaling matters because algorithms like k-means or logistic regression treat raw feature magnitude as importance, so a column measured in thousands can silently dominate one measured in single digits. Candidates should mention StandardScaler from scikit-learn for z-score normalization (mean of 0, standard deviation of 1) and MinMaxScaler when they need values compressed into a fixed range like 0 to 1. A sharp answer also notes that tree-based models like random forests don't require scaling at all, which shows they understand the reasoning instead of applying scaling as a blanket habit.
What is PCA and when would you use it?
Principal Component Analysis reduces a dataset with many correlated columns down to a smaller set of uncorrelated components that still capture most of the original variance. Analysts reach for it when a dataset has dozens of overlapping features, making visualization or modeling slow and noisy. Good candidates flag the tradeoff clearly: PCA improves speed and reduces noise, but the resulting components lose direct interpretability, so you can't easily explain what "component 2" means to a business stakeholder.
PCA trades interpretability for simplicity, and a candidate who doesn't mention that tradeoff hasn't really used it.
How do you split data into training and test sets?
This question checks whether a candidate understands why testing a model on the same data it trained on produces misleadingly optimistic results. Expect a quick, confident answer using train_test_split from scikit-learn:
from sklearn.model_selection import train_test_split

X_train, X_test, y_train, y_test = train_test_split(
    X, y, test_size=0.2, random_state=42
)
Strong candidates mention setting a random_state for reproducible results and explain stratified splitting when working with imbalanced classes, so rare categories still appear proportionally in both the training and test sets.
Preparing for your next interview
Thirty-five questions won't guarantee a perfect hire, but they give you a structured way to evaluate depth, not just memorized syntax. Candidates who stumble on edge cases, like division by zero or messy date formats, usually reveal gaps that a resume never shows. Interviewers who work through this list methodically end up comparing candidates against the same bar instead of relying on gut feel from a single conversation.
Given how much time strong screening takes, it helps to pull from a pre-vetted, verified candidate pool instead of starting from a blank slate every time you open a role. If you're hiring data analysts or other technical talent in India, you can skip the guesswork on unverified resumes entirely. Browse pre-vetted data analysis developers in India by skill and experience, and start shortlisting people who've already demonstrated the skills this list just tested for.
For engineers
Find work worth your time.
Live engineering roles across India and the US, matched to your stack. Build a profile recruiters actually discover.