Table of Contents
ToggleIntroduction
Have you ever tried untangling a set of earbuds that seem to be in a knot that defies the laws of physics? Well, that’s how data can feel sometimes—messy, overwhelming, and tangled in ways that make you question your life choices. In fact, research shows that high-dimensional data can have hundreds or even thousands of variables. For instance, in genomics, datasets can have up to 20,000 gene expression measurements for each sample. Managing and analyzing such massive datasets can be a real nightmare.
This is where Principal Component Analysis (PCA), the mathematical wizard, helps you simplify the chaos.

Don't miss out on your chance to work with the best
Apply for top global job opportunities today!
What is Principal Component Analysis (PCA)?
Principal Component Analysis (PCA) is a data simplification tool that helps you make sense of large, complex datasets by reducing the number of variables while still retaining the most important information. It’s like finding the main storyline in a novel full of subplots. PCA identifies the key components that capture the essence of your data, making it easier to analyze and visualize without getting lost in unnecessary details.
How Does Principal Component Analysis Work? The Math, Minus the Headache
PCA might sound like it’s wrapped in a cloak of mathematical mystery, but it’s really just linear algebra doing its magic. Let’s break it down step-by-step, including the formulas that make PCA tick.
1) Center Your Data
What’s Happening: Before diving into PCA, we need to standardize our data. This means subtracting the mean of each variable from the data points to ensure everything is centered around zero.
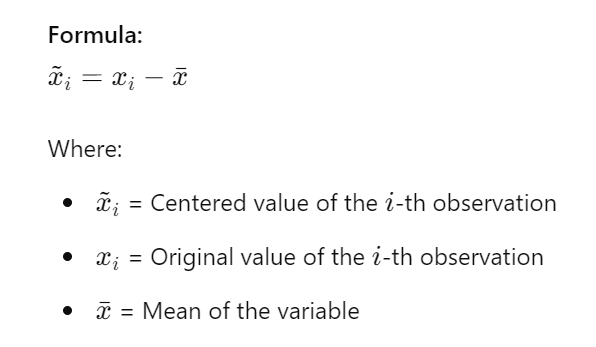
Example: Suppose you have test scores in Math (X1) and Science (X2) for several students. If the average Math score is 70 and the average Science score is 75, you subtract these averages from each student’s scores to center the data around zero.
2) Covariance Matrix
What’s Happening: Next, we calculate the covariance matrix to understand how variables are related. Covariance tells us if two variables increase or decrease together.
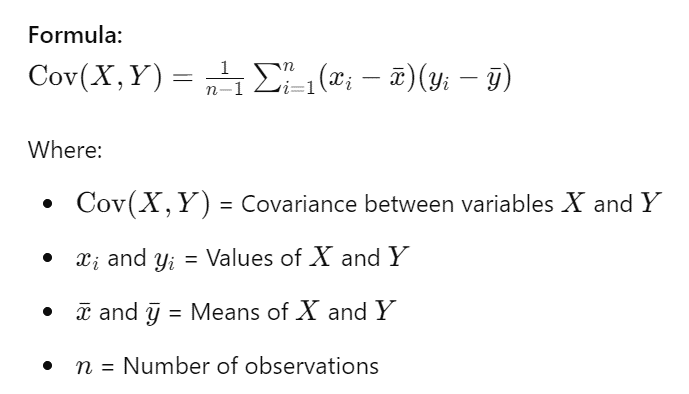
Example: For Math and Science scores, compute the covariance to see how the scores in these subjects vary together. If students who do well in Math also do well in Science, the covariance will be positive.
Must Read: Top 10 Database Management Systems in 2024 3) Eigenvalues and Eigenvectors
What’s Happening: Eigenvalues and eigenvectors help us determine the principal components of the data. Eigenvectors give us the direction of these components, while eigenvalues show how much variance each component captures.
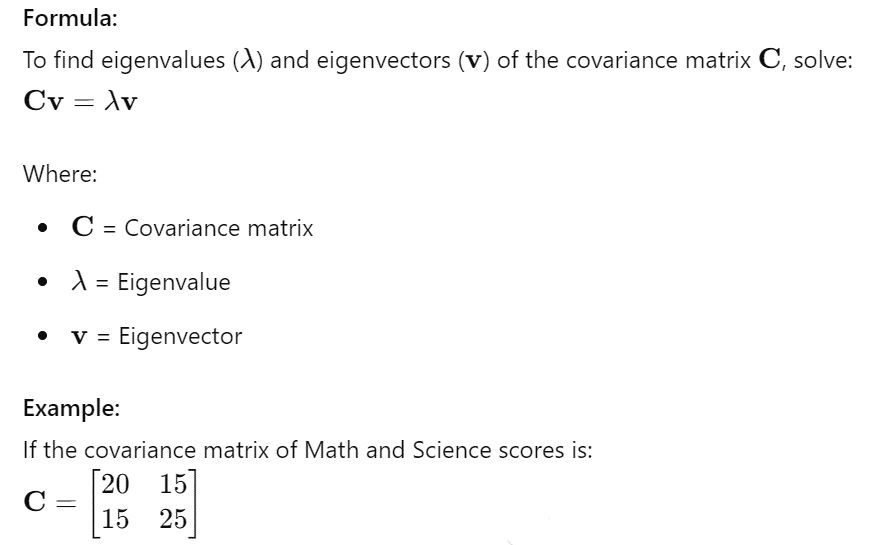
Solving the equation above will give you eigenvalues and eigenvectors that indicate the directions and magnitudes of the principal components.
4) Sort and Select
What’s Happening: Finally, sort the principal components by their eigenvalues and select the top components that capture the most variance in the data. This allows you to reduce dimensions while retaining key information.

Example: If you have 5 components and the first 2 components capture 90% of the variance, you’d select these 2 components to represent the data. This reduces complexity while preserving the essential patterns.
Read in detail: Go vs. Python: Which One is the Best to Learn? Why Should You Use PCA?
If you’re working with datasets that have more columns than you have fingers (and toes), PCA is your new best friend. High-dimensional data is not just a headache; it can also be a massive roadblock in your analysis. PCA cuts through that complexity and makes your life easier.
Imagine trying to identify patterns in a dataset with 50 variables—yikes. By reducing the number of dimensions, PCA helps you focus on what really matters, letting you spot patterns faster than a caffeine-fueled detective.
| Application Area | Description | Example |
|---|---|---|
| Genomics | Genomics Reduces thousands of gene expression measurements to identify key genetic markers. Simplifying gene expression data to find genes associated with diseases. | Genomics Reduces thousands of gene expression measurements to identify key genetic markers. Simplifying gene expression data to find genes associated with diseases. |
| Customer Segmentation | Customer Segmentation Projects high-dimensional customer behavior data into 2D or 3D for easier visualization and clustering. Creating visualizations to identify distinct customer groups based on purchasing behavior. | Customer Segmentation Projects high-dimensional customer behavior data into 2D or 3D for easier visualization and clustering. Creating visualizations to identify distinct customer groups based on purchasing behavior. |
| Machine Learning | Machine Learning Speeds up model training by reducing the number of features and thus computational load. Accelerating training times for models by applying PCA to large datasets. | Accelerating training times for models by applying PCA to large datasets. |
| Financial Forecasting | Filters out noise and improves predictive model accuracy by focusing on the most significant components. | Enhancing stock price prediction models by isolating key factors from noisy data. |
| Real Estate Valuation | Addresses multicollinearity by transforming correlated features into uncorrelated principal components. | Improving regression models by creating principal components from correlated property features. |
| Image Processing | Extracts key features from images for tasks like compression and recognition. | Using PCA to reduce dimensionality of image data, making image recognition more efficient. |
The Benefits of Using Principal Component Analysis (PCA)
Principal Component Analysis (PCA) is a powerful technique with a range of benefits, especially when dealing with complex, high-dimensional datasets. Here’s a detailed look at why PCA can be a game-changer in data analysis:
1. Dimensionality Reduction
Benefit: PCA reduces the number of variables in your dataset while retaining the most important information. This makes data easier to handle and interpret.
Explanation: High-dimensional datasets can be overwhelming and computationally expensive to analyze. PCA simplifies these datasets by transforming them into a smaller set of principal components that capture the majority of the variance. For instance, if you start with 50 variables, PCA might reduce them to just 2 or 3 components, simplifying your analysis without significant loss of information.
Example: In image processing, an image might be represented by thousands of pixels (features). PCA can reduce these dimensions to just a few components that still capture the essence of the image, making it easier to perform tasks like classification or recognition.
2. Noise Reduction
Benefit: By focusing on the principal components that capture the most variance, PCA helps in filtering out noise and irrelevant information.
Explanation: In real-world data, there is often a lot of noise or irrelevant variability that can obscure meaningful patterns. PCA identifies the directions in which the data varies the most and helps to ignore the less informative noise. This leads to cleaner, more reliable analysis.
Example: In financial analysis, stock prices are influenced by many factors, some of which are just noise. PCA can help in identifying the underlying trends and removing the noise from less significant factors, providing a clearer view of market behavior.
3. Improved Visualization
Benefit: PCA enables the visualization of high-dimensional data by reducing it to 2 or 3 dimensions that can be plotted on a graph.
Explanation: High-dimensional data is challenging to visualize. PCA simplifies this by projecting the data onto a lower-dimensional space while retaining its structure. This allows for visual inspection of patterns, clusters, and outliers.
Example: If you have data with 20 features, PCA can reduce it to 2 or 3 principal components. You can then create a 2D or 3D scatter plot to visually analyze the relationships and clusters within the data.
4. Enhanced Computational Efficiency
Benefit: With fewer dimensions, PCA can significantly speed up computation and reduce resource usage.
Explanation: Processing and analyzing high-dimensional data can be resource-intensive and slow. By reducing the number of dimensions, PCA makes subsequent computations more efficient, speeding up algorithms and reducing memory usage.
Example: In machine learning, training a model on high-dimensional data can be computationally expensive. Applying PCA first can reduce the number of features, leading to faster training times and reduced memory requirements.
5. Feature Extraction and Understanding
Benefit: PCA helps in identifying and extracting the most important features, providing insights into the underlying structure of the data.
Explanation: By transforming the data into principal components, PCA reveals which variables contribute most to the variance in the dataset. This can lead to better understanding and feature selection for further analysis.
Example: In genetics, PCA can help identify which genes contribute most to variations in gene expression across different samples, leading to insights into genetic factors associated with certain traits or conditions.
6. Handling Multicollinearity
Benefit: PCA addresses multicollinearity by transforming correlated variables into a set of uncorrelated principal components.
Explanation: Multicollinearity occurs when predictor variables in a dataset are highly correlated, leading to instability in regression models. PCA transforms the correlated variables into a set of orthogonal (uncorrelated) principal components, mitigating this issue.
Example: In a dataset with multiple financial indicators that are correlated, PCA can transform these indicators into uncorrelated principal components, improving the stability and interpretability of regression models.
Conclusion - Principal Component Analysis: The Marie Kondo Method for Your Data
Principal Component Analysis is like Marie Kondo for your data. It helps you keep what sparks joy and ditch the rest. By simplifying your data, PCA allows you to work more effectively, focus on what matters, and even impress your coworkers with those sleek 2D or 3D plots. So, the next time your dataset looks like a tangled mess of earbuds, remember that PCA is here to help—no untangling skills required.
Take control of your career and land your dream job
Sign up with us now and start applying for the best opportunities!