
Table of Contents
ToggleIntroduction
R is a widely used language for data science and statistical analysis, offering a plethora of packages that provide a diverse array of tools and functions to work with data. In this blog, we will explore the top 14 R packages essential for beginners to learn in 2023. These packages are commonly used in R projects and will serve as an excellent starting point for those just beginning their journey into the world of R. This comprehensive list includes packages for data manipulation, data visualization, machine learning, time series and date handling, and reporting and documentation. They are vital tools for efficiently working with data in R.
14 best R packages for Data Science in 2023
Data Preprocessing Packages
dplyr: Data manipulation
dplyr is a highly utilized package belonging to the Tidyverse set of libraries. It is primarily employed for data manipulation in R. The five most frequently used functions in DPLYR are mutate(), select(), filter(), summarise(), and arrange(). All these functions can be easily combined with the ‘group_by()’ function, enabling users to perform operations “by group”. In addition to data frames, dplyr facilitates efficient work with various computational backends, such as DTPLYR for large, in-memory datasets, DBPLYR for handling data stored in a relational database, and Sparklyr for sizeable datasets stored in Apache Spark.
tidyr: Data cleaning
tidyr is a powerful tool for data cleaning and restructuring in the field of data analysis and manipulation. With tidyr, users can efficiently transform messy and complex datasets into a structured and organized format. It provides a wide range of functions and operations that facilitate tasks such as splitting and combining variables, reshaping data, handling missing values, and creating new variables based on existing ones. tidyr’s intuitive syntax and flexible functions make it easy to address common data quality issues, ensuring consistency, accuracy, and coherence in the dataset. By leveraging tidyr’s capabilities, analysts can streamline their data-cleaning process and enhance the reliability and usability of their data for further analysis and modeling.
stringr: String manipulation
stringr is extensively used in data cleaning and preparation tasks. It offers a set of functions that simplify working with strings. stringr is based on the package stringi, which utilizes the ICU C library to provide fast, accurate implementations of basic string manipulations. The primary functions in stringr, starting with ‘str_’, accept a vector of strings as the first argument. Some of these functions are str_detect(), str_count(), str_subset(), str_locate(), str_extract(), str_match(), str_replace(), and str_split().

Don't miss out on your chance to work with the best!
Apply for top job opportunities today!
readr: Importing data from file formats
readr aims to provide a quick and straightforward method for reading rectangular data from delimited files, such as comma-separated values (CSV) and tab-separated values (TSV). It is designed to parse multiple data formats while offering informative problem reports when parsing yields unexpected results. readr supports several file formats using read_*() functions, including read_csv(), read_tsv(), read_delim(), read_fwf(), read_table(), and read_log(). These functions allow users to load various types of delimited files into R.
Data Visualization Packages
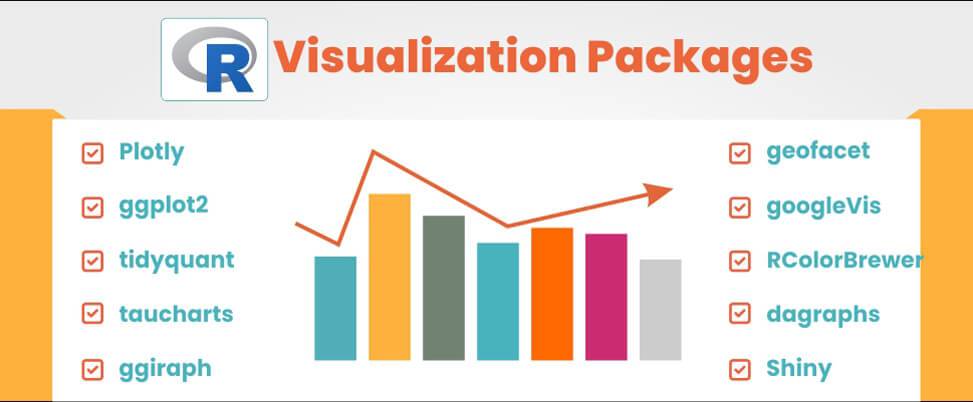
ggplot2: Versatile graphics creation
ggplot2 is a popular data visualization package for the R programming language. It is based on Leland Wilkinson’s Grammar of Graphics and allows users to create a wide range of static, animated, and interactive graphics employing a concise, consistent API. This package is particularly useful for visualizing complex data and customizing graphics. ggplot2 is widely adopted in academia and industry and has become a staple for data visualization in R. With ggplot2, users can build almost any type of chart, starting with the ggplot() function, followed by supplying a dataset and aesthetic mapping within the aes() function. Different layers can be added to create various plots, allowing for customized and aesthetically pleasing visualizations.
Plotly: Interactive plotting
Plotly is a dynamic and versatile library that enables interactive plotting in various programming languages. With Plotly, users can create visually stunning and interactive plots, charts, and graphs that can be easily embedded in web applications, reports, or presentations. The library offers a wide range of visualization options, including scatter plots, line charts, bar graphs, heatmaps, and more. What sets Plotly apart is its ability to create interactive plots that respond to user interactions, such as zooming, panning, and hovering over data points to display additional information. This interactivity enhances the data exploration and analysis experience, allowing users to dive deeper into the plotted data and gain valuable insights.
Leaflet: Mapping and geospatial visualization
Leaflet is an open-source JavaScript library primarily used to create interactive maps, which can also be used directly from the R console. Users can design and customize their maps using various combinations of map tiles, polygons, markers, lines, and more.
Machine Learning Packages
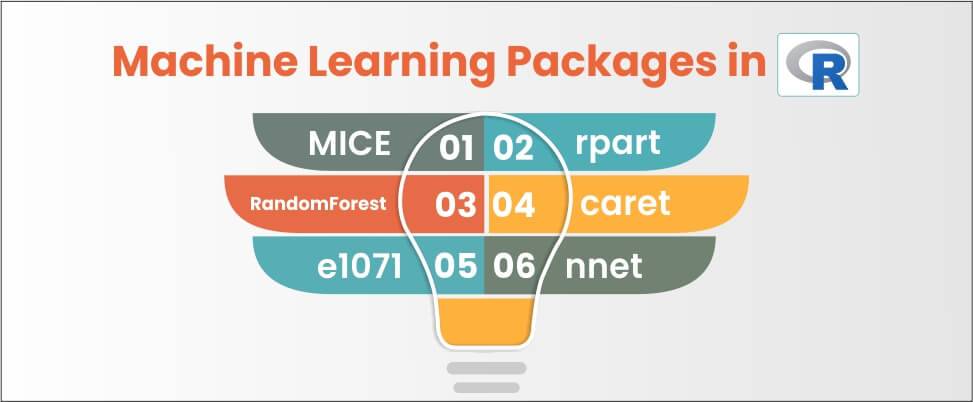
Caret: Comprehensive machine learning tools
The caret package, short for Classification and Regression Training, is a set of tools for building predictive models in R. It offers functions for preprocessing data, creating model objects, training models, evaluating model performance, and tuning model hyperparameters. caret is designed to streamline the model training process and allows users to easily compare and select from a wide range of model types and tuning parameters. It supports numerous model types, including linear and nonlinear regression, classification, and clustering algorithms, and provides a consistent interface for working with these models. Caret is extensively used for machine learning in R.
randomForest: Ensemble learning
Random Forest is a popular ensemble learning algorithm widely used in machine learning and data science. It combines the power of multiple decision trees to create a robust and accurate predictive model. The algorithm constructs a forest of decision trees, where each tree is trained on a random subset of the training data and a random subset of features. During the prediction phase, the individual tree predictions are aggregated to make the final prediction. By aggregating the predictions of multiple trees, Random Forest overcomes the limitations of individual decision trees, such as overfitting and high variance.
Search Vetted Software Developer Jobs Online at Olibr.
XGBoost: Boosting and Regression
XGBoost, short for Extreme Gradient Boosting, is a powerful machine learning algorithm known for its exceptional performance in both boosting and regression tasks. It belongs to the family of gradient boosting methods and has gained significant popularity in the data science community. XGBoost leverages an ensemble of weak prediction models, usually decision trees, and iteratively improves their predictive power by minimizing the loss function. It addresses the limitations of traditional gradient boosting algorithms by incorporating regularization techniques, handling missing values, and supporting parallel processing, making it highly efficient and scalable.
XGBoost excels in regression tasks, where its ability to capture complex nonlinear relationships and handle large datasets is particularly advantageous. Its unique feature is the automatic handling of missing data, reducing the need for extensive data preprocessing. XGBoost’s success is also attributed to its optimization for speed and efficiency, making it suitable for real-time and large-scale applications. Overall, XGBoost stands as a go-to choice for boosting and regression problems due to its impressive performance, robustness, and versatility.
Time Series and Date Handling Packages
lubridate: Date and time manipulation
The lubridate package provides a set of tools for working with date and time datasets in R. It offers functions for parsing, manipulating, and formatting dates and times, as well as performing common operations like calculating the difference between two dates or adding a specified number of days to a date. lubridate simplifies working with date and time data in R by offering a consistent, intuitive interface for everyday tasks. It also supports working with time zones and automatically handles issues such as daylight-saving time. lubridate is an essential package for beginners to become familiar with when working with date and time data in R.
Forecast: Time series forecasting
The R package “forecast” is a powerful tool for time series forecasting, designed to assist analysts and data scientists in predicting future values based on historical data patterns. The package provides a comprehensive set of functions and algorithms for time series modeling and forecasting, making it a popular choice among researchers and practitioners. With “forecast,” users can perform various tasks such as automatic model selection, decomposition of time series into trend, seasonal, and residual components, and estimation of forecast intervals. The package incorporates state-of-the-art forecasting methods, including exponential smoothing, ARIMA modeling, and dynamic regression models, allowing users to choose the most appropriate technique for their specific time series data. “Forecast” also provides visualization capabilities to help users assess the model’s performance and visualize the forecasted values alongside the observed data. With its user-friendly interface and extensive functionality, the “forecast” package has become a valuable resource for time series analysts, enabling them to make accurate and informed predictions for a wide range of applications, including sales forecasting, demand planning, financial analysis, and more.
Reporting and Documentation Packages
knitr: Dynamic report generation
The knitr package is an R package that enables users to embed R code and output in various document formats, including HTML, PDF, and Microsoft Word. It is built on top of the Sweave system, developed by Friedrich Leisch to mix R code and LaTeX documents. knitr extends the capabilities of Sweave, allowing users to include code and output from other languages like Python and SQL and create dynamic reports that can update automatically when the underlying data or code changes. knitr is a popular choice for creating reproducible research documents.
RMarkdown: Document formatting and presentation
The R Markdown package is an R package that allows users to create dynamic documents combining text, code, and output in a single document. R Markdown documents are created using a simple, easy-to-learn markup language called Markdown, a variant of the widely used Markdown syntax. R Markdown documents can be rendered in various formats, including HTML, PDF, and Microsoft Word, making them ideal for creating reproducible research, allowing users to embed R code and output directly in the document. The R Markdown package provides numerous features for formatting and customizing R Markdown documents, including the ability to include images, tables, and other formatting elements. It is a powerful tool for creating a wide range of documents.
Conclusion: Further Learning and Resources
In conclusion, the top 14 R packages for beginners in 2023 provide a comprehensive set of tools and functionality to work with data in R. From data manipulation and visualization to machine learning and dynamic documentation, these packages are essential tools for any R user. By learning to use these packages efficiently, beginners can successfully navigate the field of data science and artificial intelligence and grow their expertise in R. If you are a developer looking for data science jobs that match your skills, sign up with Olibr now!
Take control of your career and land your dream job!
Sign up and start applying to the best opportunities!

Frequently Asked Questions
R packages for data science are collections of functions, data sets, and other resources that extend the capabilities of the R programming language for data analysis, manipulation, visualization, and modeling. They provide ready-to-use tools and algorithms to streamline data science workflows.
To install an R package, you can use the install.packages() function in R. For example, to install the “dplyr” package, you can run install.packages(“dplyr”) in your R console. This will download and install the package from the Comprehensive R Archive Network (CRAN).
Once an R package is installed, you can load it into your R session using the library() function. For example, if you want to load the “dplyr” package, you can run library(dplyr). This makes the functions and datasets from the package available for use in your R session.
To handle missing values in R, you can use functions from packages like “tidyverse” or “missForest”. For example, the “tidyr” package provides the drop_na() function to remove rows with missing values, and the replace_na() function to replace missing values with specified values. The “missForest” package offers imputation methods to estimate missing values based on observed data.
Excelr Data Science offers comprehensive courses for Data Science, Artificial Intelligence, Cloud Computing, Software Testing and more.